Chapter 2: FY 2020-21 Revenues
2.0 Revenues: Chapter Overview
2.1 All University Revenues Overview
- Comparison to Financial Statements
- Overview of all Revenue Categories
- Revenue vs. Budget
2.2 University Revenues Categories
- State Operating Appropriations
- Tuition
- Grants and Contracts
- Dedicated Local
- Auxiliaries
- Stimulus
- Other Operating Revenues
- Capital Revenues
- Other Revenues (Non Operating)
2.3 State and Tuition Revenues: Historical Context
- Tuition CAP Limits
- Change in Tuition Rates
- Enrollment
- Compensation
- State vs. Tuition Fund Split
2.4 Interdepartmental Revenues
- ASA
- Other Interdepartmental Revenues
2.5 Divisional Revenue Distribution
- State Operating Budget distribution to divisions
- Divisional Detail
2.1 All University Revenues Sources
2.1.a Comparison to Financial Statements
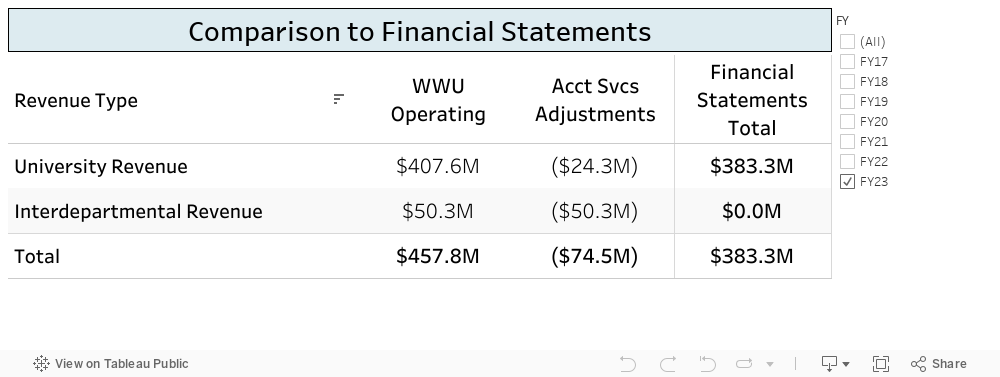
Revenue totals reported on the Financial Statements includes all university external revenues, and year-end adjustments made by Accounting Services to meet mandatory reporting requirements as shown in Table 2.1.a. The purpose of presenting these figures is to show how revenue totals in the Financial Statements are derived and demonstrate how revenue totals in this document both relate to and differ from the financial statements. The remainder of this subsection reports WWU Operating (Chart 1) revenues, which totaled $462.2 million in FY 2021. This is comprised of true, external revenues to the university (“University Revenue”) which totaled $383.1 million in FY 2021, and interdepartmental transfers of revenue (a total of $79 million in FY 2021).
Adjustments made by Accounting Services are not the focus of this document but are included here to show how totals on the Financial Statements are derived. These adjustments are recorded in Western's accounting system in Chart 8.
Table 2.1.a Comparison to Financial Statements
Relationship between operating revenues, adjustments made by Accounting Services at year end for mandatory reporting requirements, and amounts reported on the financial statements for FY2021.
Examples of adjustments made by Accounting Services include:
- Removal of Financial Aid revenue from tuition and fee revenue, auxiliary revenue. Revenues received for Financial Aid Grants & Contracts (such as the Pell Grant or Washington College Grant) are recorded in Banner under WWU Operating Revenues for Chart 1. However, these funds are disbursed to students and are “pass-through” revenues. When students pay for attendance, some of this revenue for tuition, fees, and housing and dining is paid for with student financial aid funds, resulting in a “double-counting” of revenues between financial aid grants and contracts and revenues received for student account payments. The double-counting of revenues is accounted for within the Financial Statements by an adjustment entry, but due to limitations on the level of detail, we are unable to account for this here.
- Removal of interdepartmental transfers of revenue as “true” revenue received to the university. Financial statements reporting necessitates that revenues received only be counted once. Interdepartmental transfers reflect revenue transfers that are not new receipts of revenue to the university; therefore, they are removed from Financial Statements reporting. We discuss interdepartmental transfers here because such transfers of revenue have the net effect of increasing or decreasing a given department’s spending capacity, and many departments rely upon interdepartmental support to complete their annual budgets.
2.1.b Overview of University Revenue
University Revenue refers to true, external revenue received to the University as distinguished from transfers of revenue that happen between departments. In FY 2021, WWU received in $383.1 million in external revenues. The main revenue areas are discussed briefly here, then in more depth throughout this chapter.
Interdepartmental Revenues are not considered true external revenue to the University and are therefore not included in the WWU Financial Statements. However, these revenues are included in this document because they are are considered part of departmental budgets and support the spending plan of departments. Interdepartmental revenues are discussed in more depth later in this chapter.
Revenue Categories
In FY21, Western received $88.1M in net operating fee revenue. Together, state appropriations and tuition comprise the majority of Western’s budget for operating expenses.
Western received $54.5 in Grants and Contracts revenue in FY21. This includes Financial Aid Grants and Contracts, Research Grants and Contracts, and Service Grants and Contracts.
In FY21, Western received $28.8M in dedicated local funds, which includes some mandatory fee revenue, special course fees, and revenues from OCE course offerings.
Western’s auxiliaries are self-supporting enterprises such as Housing and Dining and the Western Bookstore. In FY21, the auxiliaries received $32.0M.
Due to the COVID-19 Pandemic, Western received Federal HEERF funds to support institutional expenses and student activities, and state stimulus funds (GEER). Combined, Western received $25.5M in stimulus support during FY21.
This includes miscellaneous revenues on funds purposed for Western’s operating expenses such as earned interest on operating accounts, property management revenue and sales of surplus equipment. Total revenue for FY21 in this category was $0.8M.
Capital revenues are used for Capital Projects and maintenance expenses of existing buildings. In FY21, Western Received $54.4M in Capital revenues, which include state appropriations, revenues from the Capital Building Fee, and other sources.
This category includes external revenues received by Western but are not purposed for operating expenses. This category includes revenues such as investment income on endowments and quasi-endowments, a 4% amount from tuition dollars reserved for student financial aid, and investment income on loans. Market increases and decreases on assets are also recorded here for financial reporting purposes. Total Revenue in this category for FY21 was $7.5M.
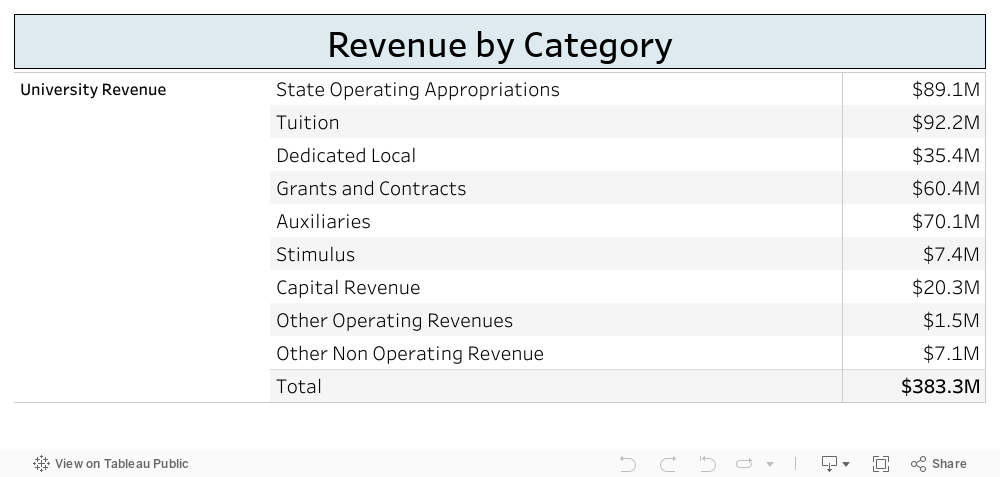
Table 2.1.b University Revenue by Category
Actual revenues received in FY 2021 by revenue source.
2.1.c Revenue vs. Budget
It is important to be clear that actual revenues and budget are not equivalent. The budget is an approved plan authorizing the use of resources for defined purposes in a given year. It is based on enrollment forecasts and on state appropriations. Actual revenues, however, represent the exact amounts received during the year. Final revenue amounts are available once the fiscal year has closed, while the budget is typically set before the year begins. Actual revenues in any given year will not match budget plans exactly.
2.2 University Revenues
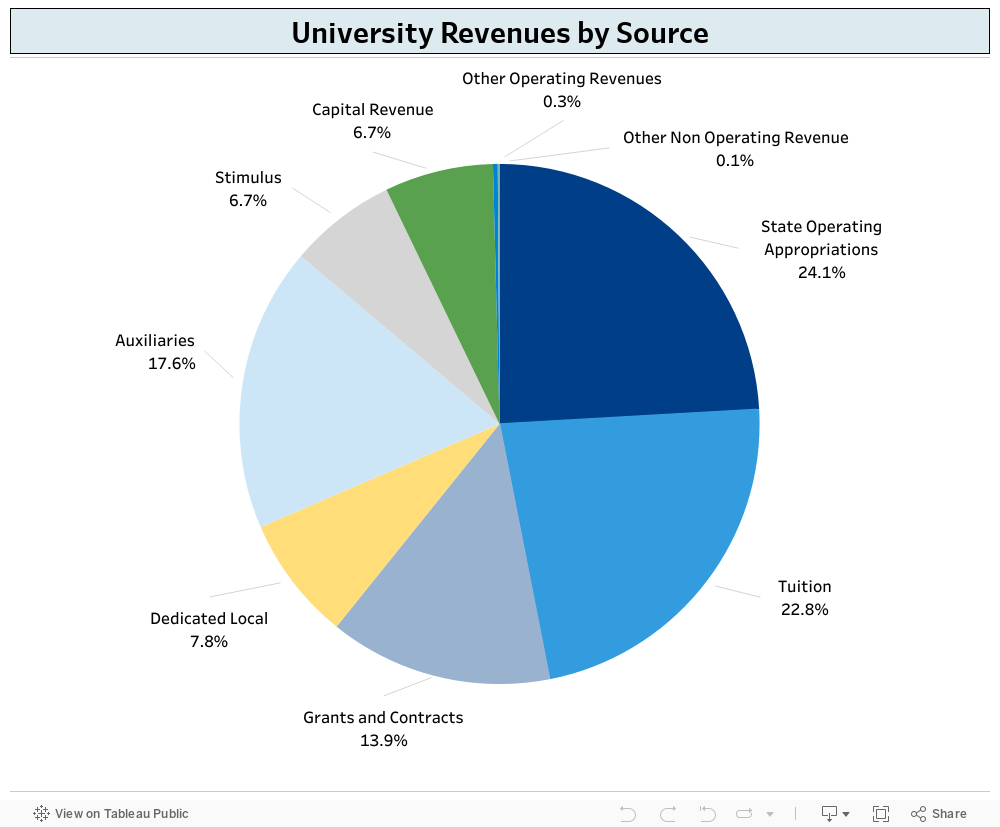
Western receives revenue from a variety of sources, including the State of Washington, that are subject to different constraints. State Appropriations and Net Operating Tuition revenue comprise the majority of the University’s total revenue and accounted for almost 47 percent of the total revenue in FY 2021.
Figure 2.2 University Revenues by Source
Relative revenues by source reflecting the funding distribution for FY 2021.
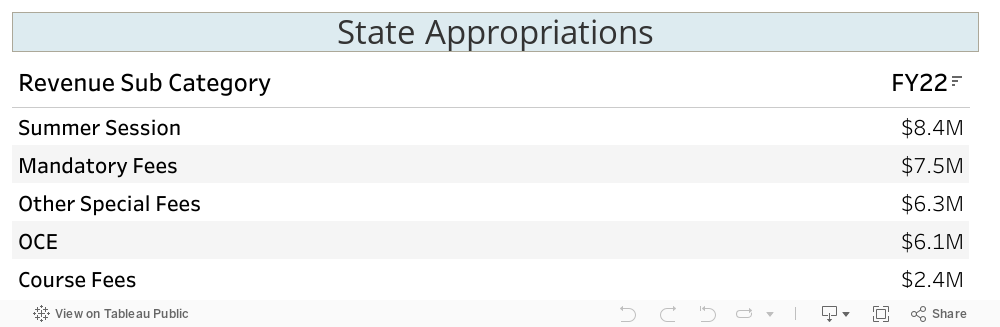
2.2.a State Operating Appropriations
Most of the state appropriation funding that Western receives is from the state General Fund, which is predominately from state sales and property taxes. Revenues from this fund are distributed to many state agencies, including those of higher education. In FY 2021, Western received $81.7 million from the General Fund. Western also receives state funding from the Education Legacy Trust Account and the Workforce Education Investment Account. State funds are subject to legislative action and are signed into law by the Governor before they are appropriated to state agencies for use.
The Education Legacy Fund was established in FY 2006 and used to expand access to higher education by providing support for new student services, financial aid, and other educational improvement efforts and the funding can only be used by programs that directly support first-year students.
Established in FY 2019, the Workforce Education Fund is used to fund educational priorities and improve access to higher education for low- and middle-income families. The funding is derived from an increase to Washington’s business and occupation (B&O) tax and provides funding for the state’s colleges and universities, career-connected learning, apprenticeship programs, and the Washington College Grant financial aid program for Washington state residents. In FY 2021, Western received $6.9 million from the Education Legacy Fund and $2.8 million from the Workforce Education Account.
Table 2.2.a State Operating Appropriations
In addition to these state operating appropriations, WWU receives funding that is distributed as part of the capital appropriations to support operating expenses for capital projects. This appropriation is discussed further in the section on Capital Revenues.
Revenues from state appropriations are used for expenses related to the university’s primary mission, such as salaries and benefits, goods and services, equipment, travel, new facilities, and the maintenance and operations of existing state-funded facilities. While most of WWU’s biennial appropriations are intended to fund current operations (maintenance-level funding), a portion is earmarked for specific legislatively mandated programs or university-initiated decision packages. Often these appropriations include substantial one-time use funding that does not continue beyond the final year of a biennium.
Western’s state appropriations have increased 11.9 percent over the past three fiscal years with the largest annual increase of 7.6 percent in FY 2020 with $2.4 million in new state funding from the Workforce Education Account. In FY 2021, revenues from state appropriations increased 4 percent and included $3.5 million from new legislatively mandated programs and university-initiated decision packages despite COVID-related fiscal impacts at the State level.
Figure 2.2.a State Operating Appropriations Historical Trends
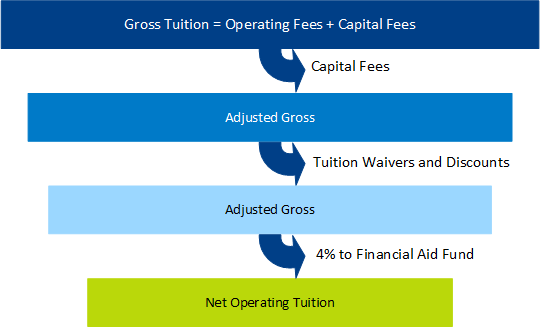
2.2.b Net Operating Tuition
Gross tuition is the amount that Western charges students, which includes charges for operating and building fees. After capital building fees are deducted, the adjusted operating tuition revenue is reduced by 4 percent for the state-mandated student financial aid fund and tuition waivers that are awarded to students. Net operating tuition reflects the remaining tuition revenue that is available to support the University’s operating expenditures.
As with state appropriations, net operating tuition revenue is used for expenses related to the university’s primary mission, such as salaries, goods and services, equipment, and travel. However, tuition revenue is highly dependent on enrollment. Before FY 2021, net operating fee revenue had increased annually following the adjustment in state support during the 2015-2017 biennium that enabled WWU to reduce the tuition rate for students for FY 2017. The reduced enrollments during the 2020-2021 academic year due to the COVID-19 pandemic resulted in a 5.3 percent decrease in net operating fee revenue revenues compared to FY 2020.
Figure 2.2.b Net Operating Tuition Revenue Trends
2.2.c Grants and Contracts Revenues
Revenues from grants and contracts are restricted and must be spent for purposes designated by the awarding agency (e.g., state, local, or federal government). Western groups these revenues into three categories based on the nature of the grants: Financial Aid Grants and Contracts, Research Grants and Contracts, and Service Grants and Contracts.
Revenues in this category reflect grants received for financial aid awards to students including the Washington College Grant ($20M), College Bound Scholarship ($0.9M), Washington State Opportunity Scholarship ($0.9M), and the Federal Pell Grant ($16M). Financial Aid also receives 4% of gross tuition revenue as shown in Figure 2.x for the institution's financial aid fund for students. Over the past five years, revenues have increased by 20%; however, the annual rate of increase has tapered in recent years with a slight reduction between FY 2020 and FY 2021.
Revenues in this category are defined in WWU's Chart of Accounts as those revenues received in Chart 1 for Fund Type 22.
Comprised of revenues from externally funded faculty research awards and cooperative agreements. Revenues are influenced by the number of proposals submitted, the number of grants awarded, and the amounts requested. Between FY 2016 and 2020 (data not available for 2021), an average of 148 research grant proposals were submitted annually with an average success rate of 43.5%.
Revenues in this category are defined in WWU's Chart of Accounts as those revenues received in Chart 1 for Fund Type 21.
Reflects industry and education partnerships (e.g., Corporate Alliance Program) and state and local grants to the Small Business Development Center. Also included in this category are grants that support programs in Everett and Western on the Peninsula.
Revenues in this category are defined in WWU's Chart of Accounts as those revenues received in Chart 1 for Fund Type 23.
Table 2.2.c Grants and Contracts
In general, WWU must make expenditures against the grant to receive funds (see discussion in the Expenditures chapter). The revenues reflected here reflect actual revenue received in the given fiscal year, rather than total grant awards because award cycles may span fiscal years. Over the past five years, total revenues from grants and contracts have increased by an average of 2.8 percent a year with most of the increase due to growth in Financial Aid Grants and Contracts. Revenue from Research Grants and Contracts declined by 9.7 percent between FY 2017 and FY 2020 before rebounding in FY 2021 to $11.1 million.
Figure 2.2.c Trends in Grants and Contracts Revenue
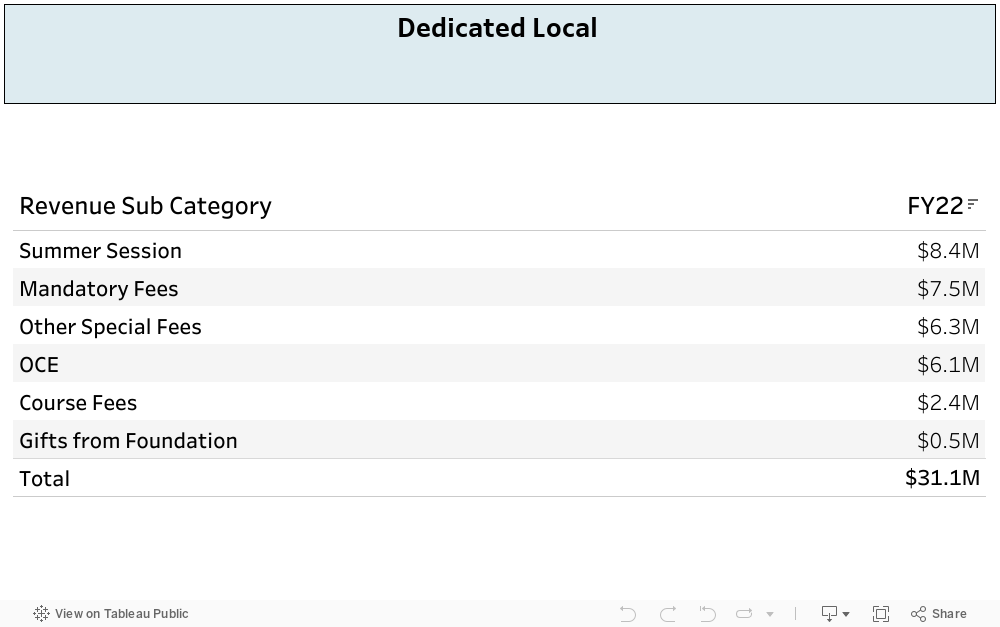
2.2.d Dedicated Local Revenues
Dedicated local revenue is generated from approved fees associated with instruction (e.g., course fees, some mandatory student fees, Summer Session fees) and service fees associated with the cost of providing goods and services to students and the campus community (e.g., admission application fees, enrollment and orientation fees, registration and transcript fees, health services fees, etc.). All fees are formally approved by the University and published annually the Fees and Rates Report available online. Revenue from collected fees can only be used for expenses that are aligned with the purposes for which the fee was established.
Revenues in this category are defined in Western's Chart of Accounts as those revenues received in Chart 1 under Fund Type 12.
Table 2.2.d Dedicated Local Revenues
In FY 2021, the University collected $28.8 M in dedicated local funds and most of that revenue ($15.3 M) was generated from Outreach and Continuing Education (OCE) for professional and continuing education programs, WesternOnline courses, and Summer Session. Some of the revenue generated by OCE is shared with academic units through internal revenue transfers (discussed in section 3.4). OCE also receives revenue from rentals of the SEA Discovery Center in Poulsbo, which was gifted to Western with $3M in gift revenue received in FY 2018 and reported as OCE revenue. However, most of the SEA Discovery Center’s revenue is recorded as Auxiliary Revenue since it is associated with activities external to the University’s operations.
Course and lab fees are associated with specific courses and cover the costs for academic departments to provide goods and services to enrolled students. Course fees must be approved by the university and used to provide consumable materials directly to students or cover specific expenses that are integral to the coursework, such as the maintenance or replacement of lab equipment and field courses in which travel is provided.
While course fees are only assessed if a student registers for a specific course, mandatory fees are charged to all enrolled students and support student-initiated activities and support services that are not State funded. The following mandatory fees are collected into dedicated local funds:
• Student Health Services Fee: supports staffing and operations within the Student Health Center, Prevention & Wellness Services, and the Counseling Center.
• Student Technology Fee: charged to students enrolled at the Bellingham campus and used to upgrade and expand technology equipment, facilities, and software on the campus.
• Sustainability, Equity, & Justice Fee: support grants to students for proposals that promote sustainability and create positive impacts on environmental, social, health, and economic practices.
• Active Transportation Fee: used by Transportation Services to fund Whatcom Transit Authority bus passes for students and a late-night shuttle service.
Revenues from other mandatory student fees are categorized as Auxiliary Revenues (discussed in section 2.2.e) and are used by the University’s auxiliary enterprises to provide services to students.
The Other Special Fees category reflects service fees that are approved by the President and are directly related to the costs of providing a specific service to students, staff, or the public. The fees include application fees, orientation fees, library fines, and transcript and graduation fees.
Overall fee revenue decreased in FY 2020 and FY 2021 compared to pre-pandemic levels due to reduced enrollments and the steps that were taken by the University to provide financial relief to students. The Board of Trustees approved large reductions to mandatory fees in Spring 2020 and some reductions continued through FY 2021. Additionally, many academic departments eliminated course fees during remote operations as online course delivery changed the nature of activities and diminished the need to provide materials to students.
Figure 2.2.d Dedicated Local Revenue Trends
2.2.e Auxiliary Enterprises
Auxiliary enterprises are self-supporting departments that provide important services and support for students, but are not funded by state operating or tuition revenue. Certain mandatory student fees are included in this category because the revenues are distributed to auxiliary departments that provide the services, such as distributions of the Services & Activity Fee, Student Recreation Center Fee, Multicultural Center Fee, and the non-academic Student Building Fee.
Auxiliary revenues are defined in Western's Chart of Accounts as revenues received in Chart 1 under Fund Type 31, with specific auxiliary units defined by the funds that belong to the units.
WWU Auxiliary Enterprises
The organization is designed and run by students with revenue support from S &A Fees and fees charged for services. The AS provides important programs and services including the Child Development Center, Outdoor Center, KUGS-FM, and the Ethnic Student Center.
Receives revenues from the sales or rental of books, supplies, and Western merchandise.
Supported by S & A Fees in addition to revenue from ticket sales and paid sponsorships.
Receives S & A Fee revenue as well as earned revenue from fees charged directly for services such as sports clubs, fitness and wellness classes, and intramural programs for students. The Wade King Student Recreation Center is supported by the Student Recreation Fee and faculty/staff and community membership fees.
Receives most of its revenue from student room and board and food services provided to campus. However, the Viking Union receives revenue from the Non-academic Building Fee and some S &A Fee revenue to improve and further develop the Viking Union on the Bellingham campus.
Some OCE program fees are considered auxiliary because they are stem from activities provided to non-Western students (e.g, Western Youth Programs and the Academy for Lifelong Learning).
Table 2.2.e Auxiliary Revenues
Since the auxiliary units primarily serve students, revenues decreased substantially in FY2021 compared to pre-pandemic levels. For example, the revenue for Housing and Dining, which includes the Viking Union, decreased 64% in FY2021 compared to FY2019.
Figure 2.2.e Auxiliary Enterprises Revenues
The impact of the coronavirus pandemic resulted in a reduction in revenues for all auxiliary areas as is evident from the five-year revenue trends. While a portion of the State and Federal stimulus funds were used to cover lost auxiliary revenue, those distributions are not reflected in these data because the support was distributed internally.
2.2.f Stimulus Funds
In recognition of the pandemic’s impact on the operations and financial outlook of universities across the nation, the Federal government established the Coronavirus Aid, Recovery, and Economic Security (CARES) Act, and subsequently the Higher Education Emergency Relief Fund (HEERF II and III), administered by the U.S. Department of Education. This provided critical financial assistance to Western that allowed the university to continue existing operations without implementing reduction in force or furlough measures, and provided student aid funds to assist continuity in enrollments. Additionally, the State of Washington provided Western funds via the Governor’s Emergency Education Relief Fund (GEER) which used CARES funds disbursed to state governments.
An allowable use of HEERF II and III Institutional funds is replacing lost revenues due to the pandemic’s impact on enrollments and services. Western accepted the majority of awarded funds on this basis with allocations to auxiliary units that were demonstrably impacted and the funding required to avoid reductions in force or accumulating negative fund balances. Additionally, a requirement of these funds is that a portion must be used by the University to provide financial aid outreach and counseling to students informing them of their opportunities to access HEERF Student Aid funds.
HEERF II and III Student Aid funds are to be used exclusively for student aid purposes, but cannot be used for recruitment of new students. Institutions have the responsibility of determining how grants will be distributed to students from these funds, how the amount of each student grant is calculated, and the development of any instructions or directions that are provided to students about the grant.
GEER funds awarded by the Washington State Office of Financial Management are restricted to direct expenses only, however the funds were provided as emergency support and to support continued operations with general flexibility. As stated in the award letter, a portion of the emergency support funds should be used to maintain support services for students of color.
Cumulatively, the stimulus funds have been used by Western for the following purposes:
- Direct costs associated with COVID response, including safety measures and testing expenses,
- Faculty salaries for conversion to a remote instruction model,
- Expenses incurred by departments to support remote work for employees, including office furniture,
- Supporting auxiliary units that were forced to cease or drastically reduce operations, or were impacted by lost revenues due to enrollments, and
- Supporting the University Operating budget by supplanting lost revenues due to enrollment losses and lessened tuition rate increases for non-resident and graduate students.
All stimulus funds provided to the University through CARES, HEERF II/III and GEER will be fully expended by the end of FY2024.
Table 2.2.f Stimulus Funds
2.2.g Other Operating Revenues
In FY 2021, Western earned an additional $800,000 of operating revenue that we classify as “Other Operating Revenues", comprised of miscellaneous revenues from operating funds that are not already categorized above. These operating revenues include interest earned on the University’s tuition fund ($0.2 million), internal services revenue from surplus sales and property management revenue ($0.1 million), and tuition revenue for the Clinical Doctorate in Audiology program. The doctoral program received $0.4 million in revenue for FY 2021 and does not receive state support.
Figure 2.2.g Other Operating Revenues Trends
2.2.h Capital Revenues
Capital revenues consist primarily of capital projects appropriations, preventative maintenance appropriations, and capital building fee revenue collected from student tuition. Revenues in this category are restricted and generally require specific authorities to expend.
Specific projects funded by capital appropriations in FY 2021 included the Interdisciplinary Science Building, among others. The amount recorded as revenue in Table 2.2.h represents reimbursements of expenditures made throughout the fiscal year. In contrast, the revenue recorded as Preventative Maintenance reflects actual revenue that was received by the University and used for appropriations in the State Capital Budget for a specific project. In this case, the specific project was Preventative Facility Maintenance and Building System Repairs.
In the last three biennia, the state has earmarked the building fee and state investment board transfers mostly for minor works preservation and classroom and lab upgrade projects. These projects modernized, preserved, and improved our existing assets. The Other Capital Revenues category included $700,000 from Foundation funds that were allocated towards the non-state funded portion of the Electrical Engineering and Computer Science building, and $1.7 million in investment income from bonds that were allocated towards Housing & Dining projects.
Capital Revenue Categories
Consists of General Obligations Bonds that are appropriated in the State Capital Budget for specific projects. The amount shown in the table represent reimbursements of expenditures made throughout the fiscal year.
The Capital Projects Appropriations category reflects revenues received in fund type 93 in Chart 1 of WWU's Chart of Accounts.
Consists of building fee (a component of Gross Tuition) and state investment board transfers. The amount reflected in the table represents actual revenue received by the University and used for appropriations in the State Capital Budget for specific projects. In this case, the specific project was Preventive Facility Maintenance and Building System Repairs. Because these funds required authority from the State to expend, they are not eligible to use for other purposes.
Revenues in this category are defined in WWU's Chart of Accounts as those revenues in Chart 1 for funds 94501 and 94502 within fund type 94.
Consists of building fee and state investment board transfers and represents actual revenue received by the University and used for appropriations in the State Capital Budget for specific projects.
Capital Building Fee & State Treasury Board Investments revenue includes revenues in Fund 90002 (account codes G101, G102, G103) in Chart 1 of WWU's Chart of Accounts.
This category is comprised of miscellaneous revenues received into capital funds purposed for specific uses and, generally, these funds are restricted. This category also includes depreciation or loss on capital assets recorded in years prior to FY2021 which are recorded for financial reporting purposes.
Revenues in this category includes all other external revenues received in Fund Types 91, 92, 93, 94, 95, 96 and 97.
Table 2.2.h Capital Revenues
Historical trends for capital revenue show substantial variation over time (Figure 2.2.h) primarily because Capital Projects Appropriations depend on appropriations for specific capital projects reimbursed during a given fiscal year. For example, state appropriations in FY 2021 were substantially higher than previous fiscal years primarily because the Interdisciplinary Science Building was mid-way through construction, and was billing, on average, between $3-4 million per month.
Figure 2.2.h Capital Revenue Trends
2.2.i Other Revenues (Non Operating)
There are other revenues received by WWU that are not purposed for operating expenditures, but some of the categories are important for financial reporting to reflect the value of institutional investment assets. These revenues are not the focus of this document, but are explained below in more detail. These revenues are restricted and are recorded in Chart 1 for financial reporting purposes.
Other Revenues (Non Operating)
Gross tuition operating fees collected are currently subject to a 4.0% minimum set-aside for the WWU student loan and grant fund. As mandated by the state, this is applicable to all public institutions of higher education in Washington. The capital building fee and student activity fee (including the student recreation fee) remain subject to a minimum 3.5% set-aside. This category also includes a 3.5% set-aside for the S&A and Multicultural Services fees.
This category reflects revenues received in fund 45000 within fund type 41 in Chart 1 of WWU's Chart of Accounts.
This includes interest earned in the Financial Aid Fund (see above) and interest earned in other loan funds.
This category reflects revenues received in fund type 41 excluding the Financial Aid Fund (45000).
Revenues in this category reflect dividend and interest income from the principle in Quasi-endowment funds. These revenues are restricted and not used for operating expenses.
Revenues in this fund type correspond to those received in Fund type 51 within Chart 1 of WWU's Chart of Accounts.
Revenues in this category reflect interest and dividend income from the principle in endowment funds. These revenues are restricted and not used for operating expenses.
Revenues in this fund type correspond to those received in Fund type 61 within Chart 1 of WWU's Chart of Accounts.
Revenues in this category are pass-through, with equal and offsetting expenses in a given fiscal year. This category primarily includes pass through funds to Aramark, one of WWU's vendors.
This category reflects revenues in fund type 81 within WWU's Chart of Accounts.
Market increases and decreases are recorded in Chart 1 for financial reporting purposes. It reflects changes on the account value without sale of the asset, therefore it is not cash on hand. Entries are made at the end of each fiscal year, then reversed off at the beginning of the new fiscal year for the prior year.
Market adjustments are reflected across several fund types but categorized separately here. This category reflects revenues in Chart 1 for all funds with revenue activity in account code G616.
Table 2.2.i Other Revenues (Non Operating)
Market gains/losses represent the largest source of variation in non-operating revenues over time. For financial reporting purposes, Western needs to present investment assets at market value which is recorded at the end of the year. In years with decreases in market value, the university records negative revenue in this category.
Agency revenue is not included in financial reporting because it doesn't represent true revenue, and it eliminated against the agency expenditures. Another distinction with the University's financial reporting is that the 4% financial aid revenue is recorded as net tuition; however, we are reflecting it as non-operating revenue in this chapter because the funds are restricted to support financial aid to students and cannot be used to support general operations.
Figure 2.2.i Other Non Operating Revenue Trends
2.3 State and Tuition Revenues: Historical Context
2.3.a Tuition CAP Limits
During the 2015 legislative session, Washington State lawmakers passed the College Affordability Program, which lowered tuition for Washington public colleges and universities for two consecutive academic years. Beginning in the 2017-18 academic year, annual tuition increases were tied to the fourteen-year moving average of growth rate in median hourly wage. To accommodate the reduction in tuition operating fee revenue, the legislature is required to backfill the loss of revenue with tuition backfill funding, which is adjusted for inflation as specified in statute. However, public universities are limited in their ability to raise revenues through tuition rate increases on resident undergraduate students.
2.3.b Changes in Tuition Rates
Although student tuition rates have increased over time, rate increases for resident students are limited by state statute. Generally, operating fee rates have increased by approximately 2.5 percent per year, and Western's Board of Trustees has approved rate increases for non-resident students that generally mirror that of resident students. Even with the state tuition backfill funding, the limits on resident student tuition increases places constraints on Western's operating budget capacity.
Figure 2.3.b Tuition Rates
Select a student attribute from the options below. The chart will automatically update.
To view this chart and more in full size, visit the full workbook.

2.3.c Enrollment
Enrollments declined by 6 percent in FY 2021 (2020-2021 academic year) compared to pre-pandemic levels (WWU Factbook). While enrollment declined for all categories of undergraduate students, the decline was most pronounced for freshman with 20% decreases in the number of resident and non-resident students compared to FY 2020. The impact of the pandemic on enrollments will likely continue because the smaller freshman class will impact the number of continuing students in subsequent years.
2.3.d Compensation
Employee compensation, including salaries and benefits, comprises the largest use of Western’s annual operating budget. Funding for new positions can either be obtained by the state through a formal budget request from Western (Decision Package), other legislative action, or can be allocated to a division through Western’s annual internal budget process through operating fee revenues. Typically, increases to employee compensation are granted on an annual basis, and the level of funding the state appropriates for all employees is usually tied to the increases agreed upon through statewide collective bargaining. However, the state only provides funding for a portion of these increases, with the rest to be funded by assumed increases in Western’s operating fee revenues through rate and enrollment increases. The state determines the percentage it will fund, with Western covering the difference. As the state legislature simultaneously caps tuition rate increases for undergraduate resident students, this creates an additional constraint on Western’s operating budget.
Western may also provide compensation increases to employees in addition to the level funded by the state, either as bargained through unions representing Western’s employees or in accordance with compensation programs for non-represented employees, however the budget for these increases is funded entirely through operating fee revenues, or through increases in fees and rates for employees in auxiliary or self-sustaining units.
2.3.e State vs. Tuition Fund Split
Western’s state operating expenditures have historically been supported by state appropriations and net tuition operating fees. State funding reductions during the Great Recession shifted the cost of higher education in Washington to students and their families. During the 2015-2017 biennial legislative session, the legislature committed to buying back some of the cuts realized during the Great Recession, which resulted in reduced tuition for resident undergraduates. As a result, the share of state support has increased over the last several years benefitting Washington state students and families. In recent years, Western’s operating budget has been split approximately 50/50 between state appropriations and tuition operating fee revenue.
Please note that the amounts reflected in Figure 2.3 are the budgeted figures prior to the start of the fiscal year and not actual revenues received. We present the budgeted figures because this approach has formed the basis of decisions surrounding the planning of Western's Operating Budget.
Figure 2.3.e State vs. Tuition Fund Split History
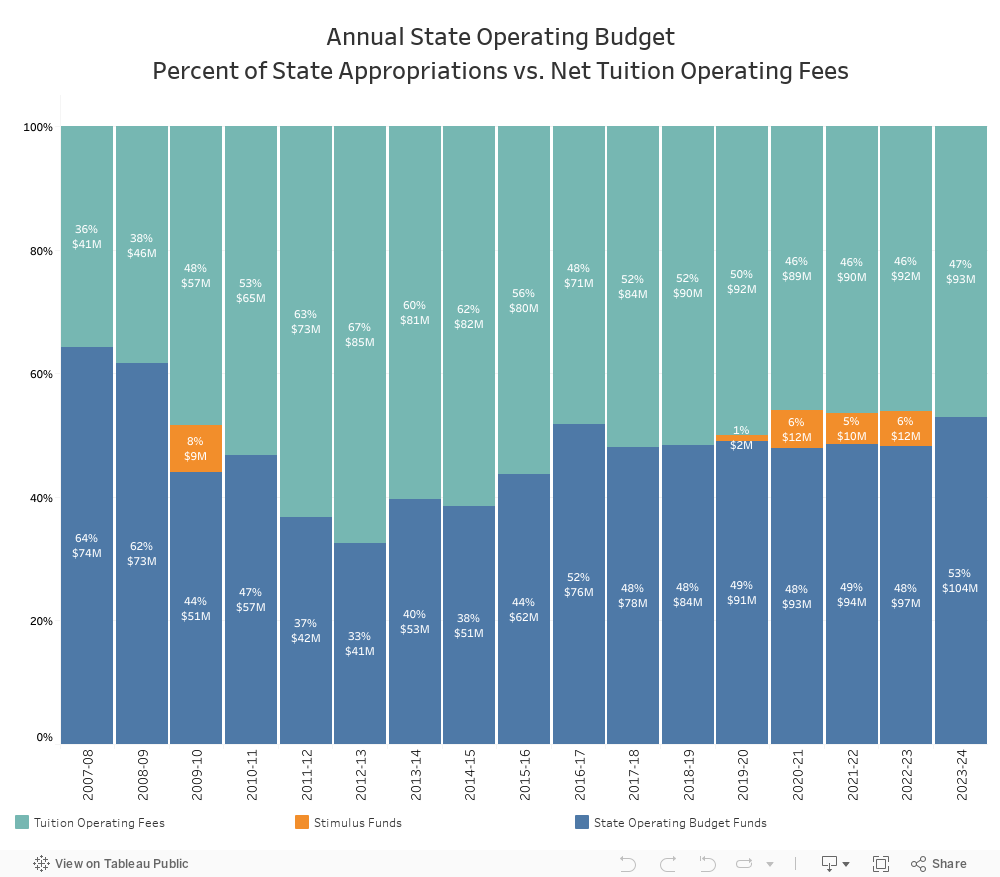
Western’s budget continues to face ongoing pressures due to demands for funds and limits on revenue sources. Washington state statute limits the increases on in-state tuition each year to increase by no more than the average annual percentage growth rate in the median hourly wage for Washington for the previous fourteen years. In recent years, this equates to approximately 2.5 percent increase annually in tuition operating fee rates. Inflationary increases for fixed costs such as salary increases must be covered in part by tuition funds. For example, a 3 percent salary increase for faculty and staff equates to a 1.5 percent increase in state appropriated dollars and 1.5 percent increase funded from tuition revenues. State appropriations may be purposed and lack flexibility for use, such as proviso funding awards. Finally, any legislatively unfunded mandates must be covered by institutional dollars which further constrains Western’s budget and limits capacity for funding in other areas.
During the COVID-19 pandemic, Western received additional federal and state stimulus funds which allowed for continued operations and reduced additional burdens to students beyond annual increases allowed by state statute that are voted on and approved by the Board of Trustees.
2.4 Interdepartmental Revenues
Interdepartmental revenues are not “true” revenue to the university because the receipt of the revenue is initially reflected in one the categories discussed above and later transferred to another department. Interdepartmental support is incorporated into the budgets of individual departments, adding to spending capacity of a given area, and collectively reflect the level of redistribution of revenue within the institution. There are two interdepartmental revenue types: ASA revenue and interdepartmental revenue/recharges.
Table 2.4 Interdepartmental Revenue
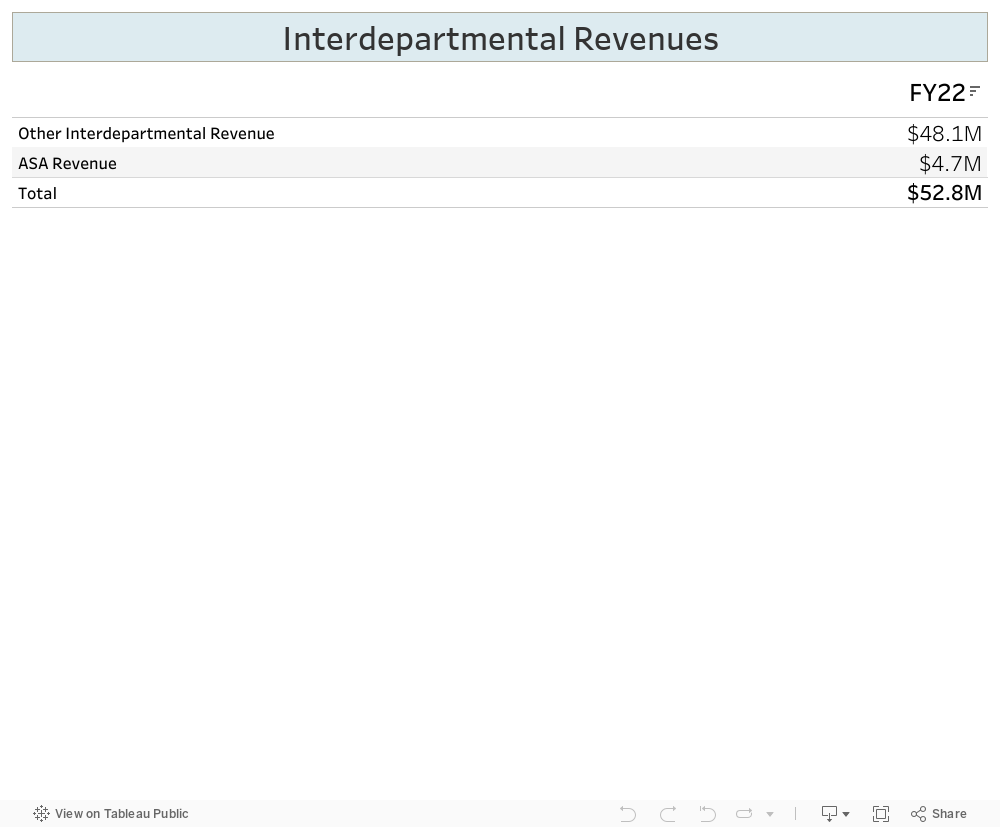
2.4.a Administrative Services Assessment (ASA)
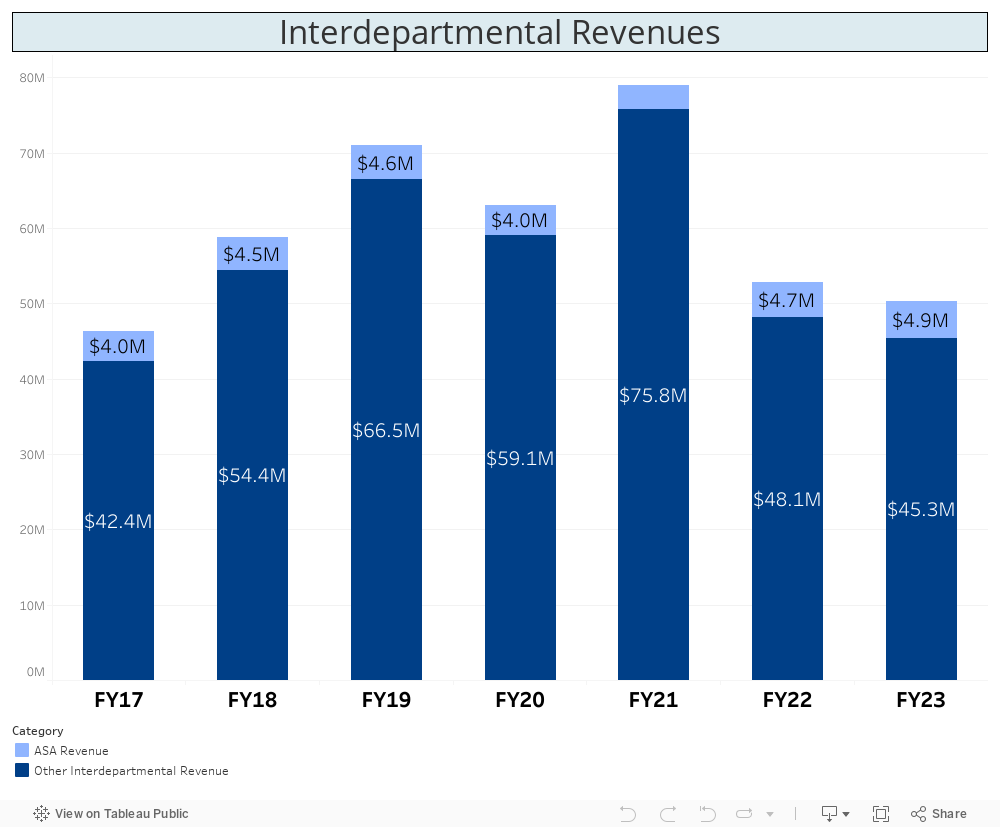
The Administrative Services Assessment (ASA) fee is intended to partially recapture overhead costs associated with state-supported departments providing general administrative support to auxiliary areas and/or activities. ASA fees are deposited into the University’s institutional budget and used to support internal funding requests and contingency needs. The decreases in ASA revenues for FY2020 and FY2021 was indicative of a reduction in revenues received during the pandemic.
2.4.b Internal Service Recharge/Other Departmental Support
This category reflects redistribution of resources within the university, which occurs when an area charges other departments for internal services or there is a funding transfer between departments. For example, self-supporting units that provide goods or services to other departments are able to offset costs through internally charges (recharges) based on identifiable direct and indirect costs. Interdepartmental support transfers are also used when multiple departments collaborate on activities that are financially managed by a single unit (e.g., Summer Session revenue sharing and large, special events).
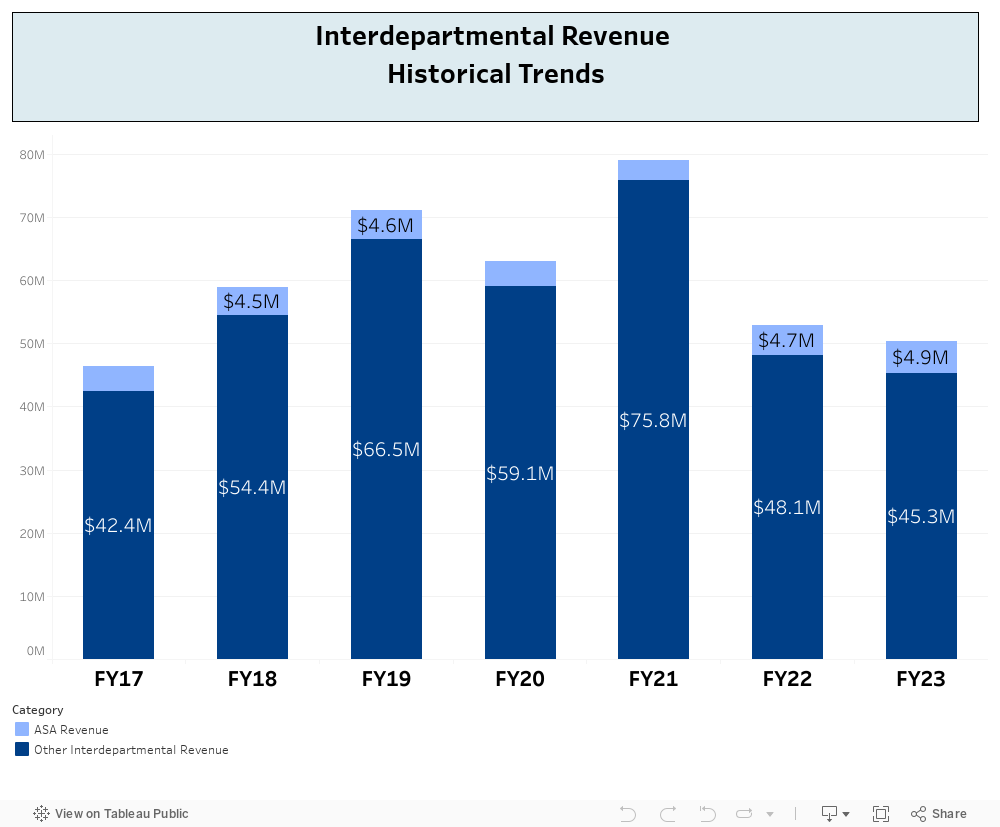
The increase in interdepartmental revenue transfers observed in FY 2021 was primarily due to a $39.3 million transfer of bond proceeds for the new Alma Glass Residence Hall. The bond proceeds were transferred to offset construction costs as the project was mid-way through construction in FY 2021.
Figure 2.4 Interdepartmental Revenues Historical Trends
2.5 Divisional Revenue Distribution
Within Western, each division relies on a unique combination of revenue sources that reflects the nature of their operations. Divisions that rely on dedicated local and auxiliary revenues from providing goods and services were most impacted by the pandemic and remote operations.
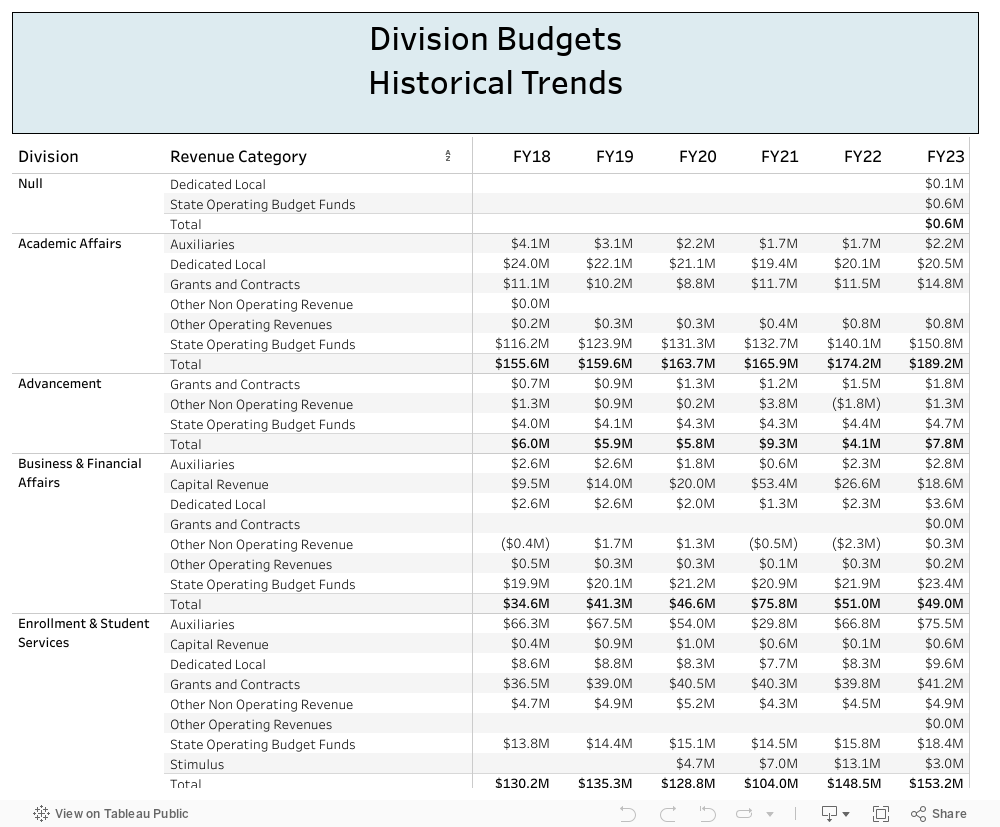
Table 2.5 Divisional Budgets
Divisional funding distributions for each division over the past five years.
This is an interactive table; to view funding trends at the department level, hover your cursor over the label "Division" and select the "+" symbol that appears.